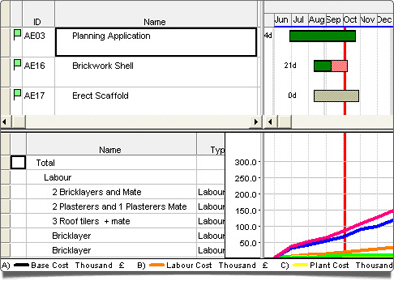
Track tasks, finances and amends. Easily manage your project and track any agreed changes to the work in your build programme as the project progresses. Store a baseline to provide you with a snapshot of what things should have been happening and when versus any changes later made to the programme to show 'as built versus programme’.
Add "Baselines" to track any amends to the project
If you want to track the amends to your bar chart throughout the job (ie. weather delays) then you can store a baseline which will indicate on the revised bar chart where the work should have commenced. This is indicated by a black bold line underneath each amended phase of the job.
It's useful to use Baselines in construction so you can analyse the impact of the delay on the job, both for the customer and for your own assessment of how you're doing vs your initial estimate for completion.
Show planned vs actual progress on the job
Labels showing the actual quantity of days you are into a task, as well as colour-coding on the bar chart, indicates how complete each task is. (In the example above the green area of the bar shows how complete each task is along with the number of days as a label on the chart.)
Monitor allocation of resources, cash flow and revenue
ProjectXpert will plot cumulative line graphs showing costs and revenue over time allowing you to effectively plan your payments and optimise your cash flow throughout the job.
The software also generates histograms instantly to look at any over/under allocation of resources.


