


Just because ProjectXpert is much easier to use than the likes of Microsoft Project, doesn’t mean it isn’t packed full of useful features including Critical Path. In fact the combination of HBXL’s estimating software EstimatorXpress and ProjectXpert make the most complete, powerful solution to project management on the market!

1
The Project Builder guides you through creation of the project
It's easy to create a new project using the Project Builder following 8 steps to enter your project details quickly and simply.
2
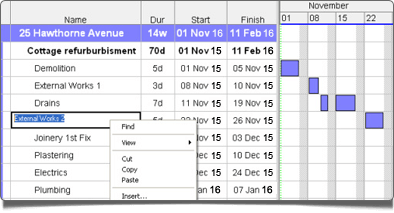
Create, edit or delete tasks and build phases with ease
All you need to do is list the tasks that need carrying out by entering them into the Activity Sheet giving each task a name, duration and start date. ProjectXpert will then automatically create your Gantt chart/bar chart.
Or you can draw bars and links directly on to screen. You can also copy and paste to and from MS Excel and other Windows software.

3
Add milestones
You can also add milestones or decision points for when specific actions need to be completed. For example you might want to indicate payment dates, completion dates or highlight important phases of the job.

4
Add sub-tasks to tasks and link related activities
ProjectXpert Indent Button - Using the 'Indent' button you can define sub-tasks underneath main tasks to indicate that these need to be completed in order for the main Task to be completed.
Using Drag & Drop functionality you can link tasks to each other so that tasks become dependent on another being completed first. (Well you can't put a roof on without walls can you!)
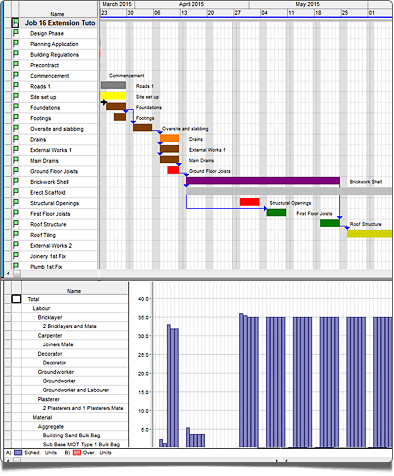
Assign resources to tasks, sub-tasks and build phases.

5
Assign Resources to tasks
Associate materials, labour, plant and other resources to each task in the job including costs and quantities.
You can assign an unlimited amount of resources (such as materials, labour or plant) to each individual task ProjectXpert will then give you visual indicators to see where resources are over or under-allocated, and the ability to drill into stages of each job for analysis.

6
Add "Baselines" to track any amends to the project
If you want to track the amends to your bar chart throughout the job (ie. weather delays) then you can store a baseline which will indicate on the revised bar chart where the work should have commenced. This is indicated by a black bold line underneath each amended phase of the job.
It's useful to use Baselines in construction so you can analyse the impact of the delay on the job, both for the customer and for your own assessment of how you're doing vs your initial estimate for completion.
7
Show planned vs actual progress on the job
Labels showing the actual quantity of days you are into a task, as well as colour-coding on the bar chart, indicates how complete each task is. (In the example above the green area of the bar shows how complete each task is along with the number of days as a label on the chart.)

8
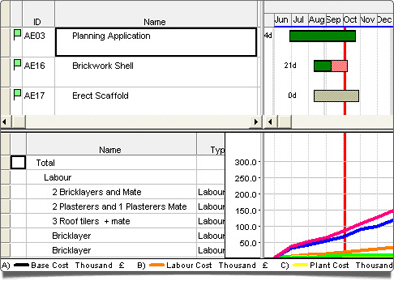
Monitor allocation of resources, cash flow and revenue
ProjectXpert will plot cumulative line graphs showing costs and revenue over time allowing you to effectively plan your payments and optimise your cash flow throughout the job.
The software also generates histograms instantly to look at any over/under allocation of resources.
9
Bar charts, histograms and other reports
Create quick presentation reports including barchart, resource histogram, s-curve & cash-flow

10
Customise the look and feel of your charts
You can choose different colours for different tasks and build phases to visually distinguish certain activities from others. You have the option to do this manually or you can assign colours to certain task types using codes.
It's also possible to add patterns, shading, outlines, symbols and more to your bars for even more granular differentiation of tasks.

11
Export dates into iCalendar format...
ProjectXpert gives you the option to save your project as an iCalendar file type. This means you can then import the project dates into MS Outlook, Google Calendar and many other day-to-day calendar software packages.
This is particularly useful as you'll then be able to use software such as MS Outlook to electronically remind you of impending tasks.

12
Print your chart, export to MS Excel or email to clients
When you print your chart there are a number of tools allowing you to add professional footers and headers, show as little or as much detail as you want and scale the charts.
Print to A4, A3 as a single page or produce multi-page wall charts.
Copy the graphs and tables to your clipboard to email, or alternatively print to HTML and/or PDF file types to publish to the web.
Export your reports to MS Excel for ultimate flexibility or for import into your accounts system.
13
Plus
Multi-level undo/redo facility
Create To-do list and notes per activity
Text and graphic annotations can be placed anywhere on barchart/histogram
Filter, sort and group by any field
